
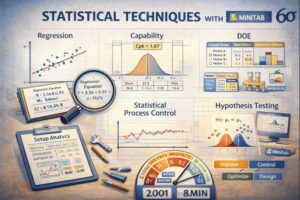
MINITAB is a powerful data analysis and graphical representation software, being the industry standard in quality improvement initiatives. It provides all the necessary tools to efficiently analyze data and find solutions to the most difficult business problems.
The advanced level focuses on using complex statistical techniques to demonstrate cause-effect relationships within processes. The course covers various applications, from graphical analysis and stability to hypothesis testing, Design of Experiments (DOE), and Response Surface Method, giving participants the ability to transform raw data into well-founded strategic decisions.
Essential Information
- Duration: 5 days
- Recommended participants: 5-10
- Level: Advanced / Expert in Data Analysis
Target Audience:
- Technical staff from production, quality, engineering, maintenance, or logistics departments.
- Process Engineers and management involved in continuous improvement.
- Lean and Six Sigma specialists.
- Professionals from various fields (commercial, financial services, healthcare, IT, etc.).
- Entrepreneurs and Consultants.
- Employees interested in professional development in applied statistics.
Learning Objectives
At the end of the training, participants will be able to:
- Graphically analyze data using tools such as Histogram, Boxplot, Pareto, or Time Series Plot.
- Determine process stability and capability.
- Perform advanced Measurement System Analysis (MSA).
- Use hypothesis testing to validate statistical differences.
- Identify and model relationships between variables through correlation and regression.
- Apply DOE techniques for process optimization.
Course Structure
- Introduction to Minitab: Interface and basic data management.
- Graphical Analysis: Visualizing distributions and trends (Histogram, Boxplot, Scatter Plot).
- Stability and Capability: Control Charts and Capability Analysis (Cp, Cpk).
- Measurement System Analysis (MSA): Validating data precision and accuracy.
- Hypothesis Testing: Advanced techniques (ANOVA, T-Test, Test of Equal Variance).
- Correlation and Regression: Analyzing relationships between variables (Scatter Plot, Multiple Regression).
- Optimization: DOE (Design of Experiment) and RSM (Response Surface Method).
- Summary and final practical applications.
Organizational Benefits
- Rapid Analysis: Increasing the speed of processing large volumes of data.
- Informed Decisions: Basing management actions on incontestable statistical evidence.
- Trend Identification: Early detection of patterns and anomalies in processes.
- Performance Optimization: Improving operational efficiency by fine-tuning critical variables.
- Risk Reduction: Identifying risks before they produce costly defects.
- Compliance: Aligning with international quality standard requirements (IATF, ISO, etc.).
We recommend participants have access to a laptop with MINITAB software installed (trial version available). It can be downloaded from the MINITAB website: https://www.minitab.com/en-us/products/minitab/free-trial/
The course will conclude with a multiple-choice examination, and participation statements or graduation certificates will be issued, as applicable.
Contact
Please contact us for further information or personalized offers.
- 📧 Email: george@sanconsulting.ro
- 📞 Phone: +40 723093515
- 🌐 Web: sanconsulting.ro/contact